


Lời nói đầu
Bộ sách IELTS năm ngoái của mình đã giúp rất nhiều bạn đạt được số điểm mục tiêu mà không cần tốn tiền cho bất cứ khóa học nào. Tiếp nối sự thành công đó, trong cuốn sách này, mình sẽ giúp các bạn tiếp cận và hoàn thành từng dạng bài trong IELTS Writing.
Bộ sách của mình nói chung và cuốn sách này nói riêng đều nhằm mục đích nâng cao khả năng tiếng anh của bạn một cách tốt điện đồng thời định hướng các bạn học IELTS theo các tiêu chí chấm điểm, tư duy đề của giám khảo thay vì học tràn lan tránh việc lãng phí thời gian, tiền bạc.
Mình rất mong nhận được sự phản hồi về ưu nhược điểm của cuốn sách từ các chính bạn đọc để mình cải thiện chất lượng tài liệu hàng ngày.
Thái Hoàng!
IELTS WRITING TASK 1
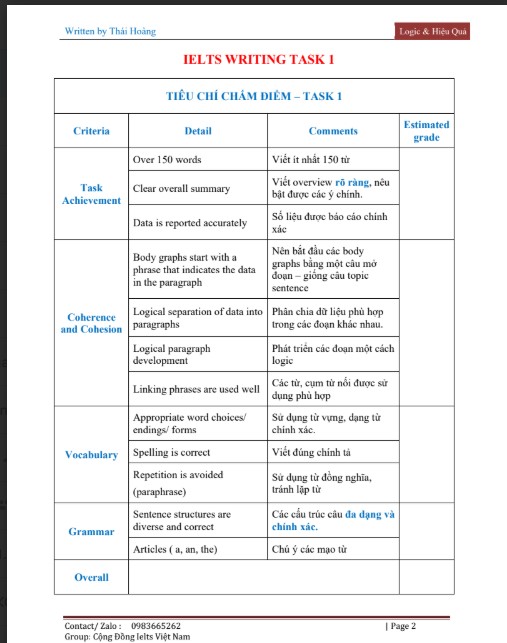
TIÊU CHÍ CHẤM ĐIỂM – TASK 1
| Criteria | Detail | Comments | Estimated grade |
| Task Achievement | Over 150 words | Viết ít nhất 150 từ | |
| Clear overall summary | Viết overview rõ ràng, nếu bật được các ý chính. | ||
| Data is reported accurately | Số liệu được báo cáo chính xác | ||
| Coherence and Cohesion | Body graphs start with a phrase that indicates the data in the paragraph | Nên bắt đầu các body graphs bằng một câu mở đoạn – giống câu topic sentence | |
| Logical paragraph development | Phát triển các đoạn văn một cách logic | ||
| Linking phrases are used well | Các từ, cụm từ nối được sử dụng phù hợp | ||
| Vocabulary | Appropriate word choices/ endings/ forms | Sử dụng từ vựng, dạng từ chính xác. | |
| Spelling is correct | Viết đúng chính tả | ||
| Repetition is avoided (paraphrase) | Sử dụng từ đồng nghĩa, tránh lặp từ | ||
| Grammar | Sentence structures are diverse and correct. | Các cấu trúc câu đa dạng và chính xác. | |
| Articles (a, an, the) | Chú ý các mạo từ | ||
| Overall |
UNIT 1: PHƯƠNG PHÁP LÀM BÀI LINE GRAPH
- Phần tóm tắt ví dụ.
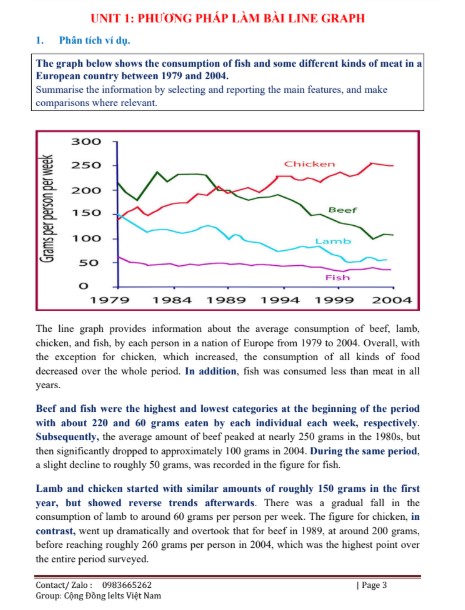
The graph below shows the consumption of fish and some different kinds of meat in a European country between 1979 and 2004.
Summarise the information by selecting and reporting the main features, and make comparisons where relevant.
(Image of a line graph showing consumption in grams per person per week from 1979 to 2004 for Fish, Lamb, Beef, and Chicken.)
The line graph provides information about the average consumption of beef, lamb, chicken, and fish, by each person in a nation of Europe from 1979 to 2004. Overall, with the exception for chicken, which increased, the consumption of all kinds of food decreased over the whole period. In addition, fish was consumed less than meat in all years.
Beef and fish were the highest and lowest categories at the beginning of the period with about 220 and 60 grams eaten by each individual each week, respectively. Subsequently, the average amount of beef peaked at nearly 250 grams in the 1980s, but then significantly dropped to approximately 100 grams in 2004. During the same period, a slight decline to roughly 50 grams, was recorded in the figure for fish.
Lamb and chicken started with similar amounts of roughly 150 grams in the first year, but showed reverse trends afterwards. There was a gradual decline in the consumption of lamb to around 60 grams per person per week. The figure for chicken, in contrast, went up dramatically and overtook that for beef in 1989, at around 200 grams, before reaching roughly 260 grams per person in 2004, which was the highest point over the entire period surveyed.
Cấu trúc chung của 1 bài line graph
Introduction:
The line graph compares/ illustrates/shows/gives information about/ reveals statistics about/ details changes in/ provides information about/ reveals information about/ provides information about/paraphrase đề bài + over a period of — years/ over a — year period/from — to —, between — and —.
The line graph provides information about the average consumption of beef, lamb, chicken, and fish, by each person in a nation of Europe, from 1979 to 2004.
Overview:
Overall/ Looking from an overall perspective/It is clear/obvious that/ It clearly shows that + Xu hướng chung 1+Xu hướng chung 2.
Overall, with the exception for chicken, which increased, the consumption of all kinds of food decreased over the whole period. In addition, fish was consumed less than meat in all years.
Body 1:
Chọn, phân tích và so sánh 2 dãy, phân tích từng dãy một, chú ý các điểm đỉnh, đáy, đầu, cuối.
Beef and fish were the highest and lowest categories at the beginning of the period with about 220 and 60 grams eaten by each individual each week, respectively. Subsequently, the average amount of beef peaked at nearly 250 grams in the 1980s, but then significantly dropped to approximately 100 grams in 2004. During the same period, a slight decline to roughly 50 grams, was recorded in the figure for fish.
Body 2:
So sánh các dãy còn lại, phân tích từng dãy một, chú ý các điểm đỉnh, đáy, đầu, cuối.
Lamb and chicken started with similar amounts of roughly 150 grams in the first year, but showed reverse trends afterwards. There was a gradual decline in the consumption of lamb to around 60 grams per person per week. In contrast, the figure for chicken, went up dramatically and overtook that for beef in 1989, at around 200 grams, before reaching roughly 260 grams per person in 2004, which was the highest point over the entire period surveyed.
- S + V + Adv, then continued to V at a higher level (the same direction)
From 1979 to 1994, the weekly consumption of beef decreased from around 220 to 180 grams, then continued to decline at a higher level to over 100 grams in 2004. - Before/after + Ving, S + V + Adv
Before decreasing dramatically to roughly 100 grams in 2004, the consumption of beef increased slightly to peak at nearly 250 grams in 1984 from around 220 grams in 1979. - S + V + Adv, but then V + more Adv (the opposite directions)
The consumption of beef increased slightly to a peak of nearly 250 grams in 1984 from around 220 grams in 1979, but then decreased dramatically to roughly 100 grams in 2004. - There was a/an + Adj + N, which was followed by a/an adj + N
In 1984, there was a light increase to a peak of nearly 250 grams from around 220 grams in the consumption of beef, which was followed by a dramatic decrease to roughly 100 grams in 2004.
Liên kết các câu bằng các từ nối
While/ Whilst/ Whereas the average amount of chicken rose significantly from about 140 grams to 250 grams, there was a steep decline from 150 grams to around 60 grams in the average consumption of lamb.
While/ Whilst/ Whereas beef consumption experienced a sharp decrease from roughly 220 grams to 100 grams, a slight fall of approximately 10 grams from nearly 60 grams was recorded in the figure for fish.
The average amount of chicken rose significantly from about 140 grams to 250 grams. However/ In contrast, there was a steep decline from 150 grams to around 60 grams in the average consumption of lamb.
Contact/ Zalo : 0983665262 | Page 13
Group: Cộng Đồng Ielts Việt Nam
- Body 1
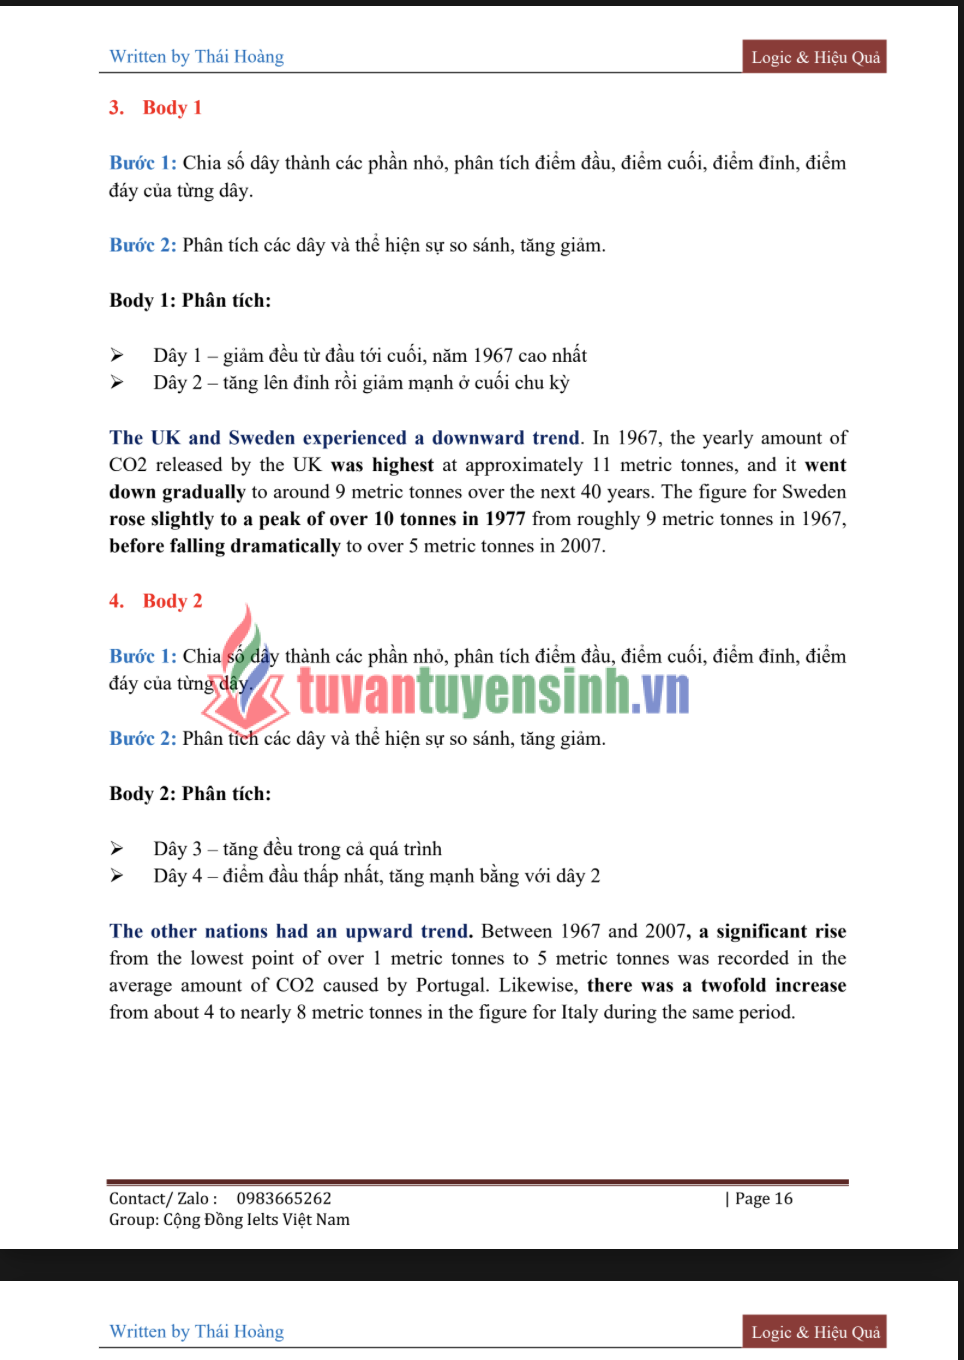
Bước 1: Chia số dây thành các phần nhỏ, phân tích điểm đầu, điểm cuối, điểm đỉnh, điểm đáy của từng dây.
Bước 2: Phân tích các dây và thể hiện sự so sánh, tăng giảm.
Body 1: Phân tích:
Dây 1 – giảm đều từ đầu tới cuối, năm 1967 cao nhất
Dây 2 – tăng lên đỉnh rồi giảm mạnh ở cuối chu kỳ
The UK and Sweden experienced a downward trend. In 1967, the yearly amount of CO2 released by the UK was highest at approximately 11 metric tonnes, and it went down gradually to around 9 metric tonnes over the next 40 years. The figure for Sweden rose slightly to a peak of over 10 tonnes in 1977 from roughly 9 metric tonnes in 1967, before falling dramatically to over 5 metric tonnes in 2007. - Body 2
Bước 1: Chia số dây thành các phần nhỏ, phân tích điểm đầu, điểm cuối, điểm đỉnh, điểm đáy của từng dây.
Bước 2: Phân tích các dây và thể hiện sự so sánh, tăng giảm.
Body 2: Phân tích:
Dây 3 – tăng đều trong cả quá trình
Dây 4 – điểm đầu thấp nhất, tăng mạnh bằng với dây 2
The other nations had an upward trend. Between 1967 and 2007, a significant rise from the lowest point of over 1 metric tonnes to 5 metric tonnes was recorded in the average amount of CO2 caused by Portugal. Likewise, there was a twofold increase from about 4 to nearly 8 metric tonnes in the figure for Italy during the same period.
Contact/ Zalo : 0983665262 | Page 16
Group: Cộng Đồng Ielts Việt Nam
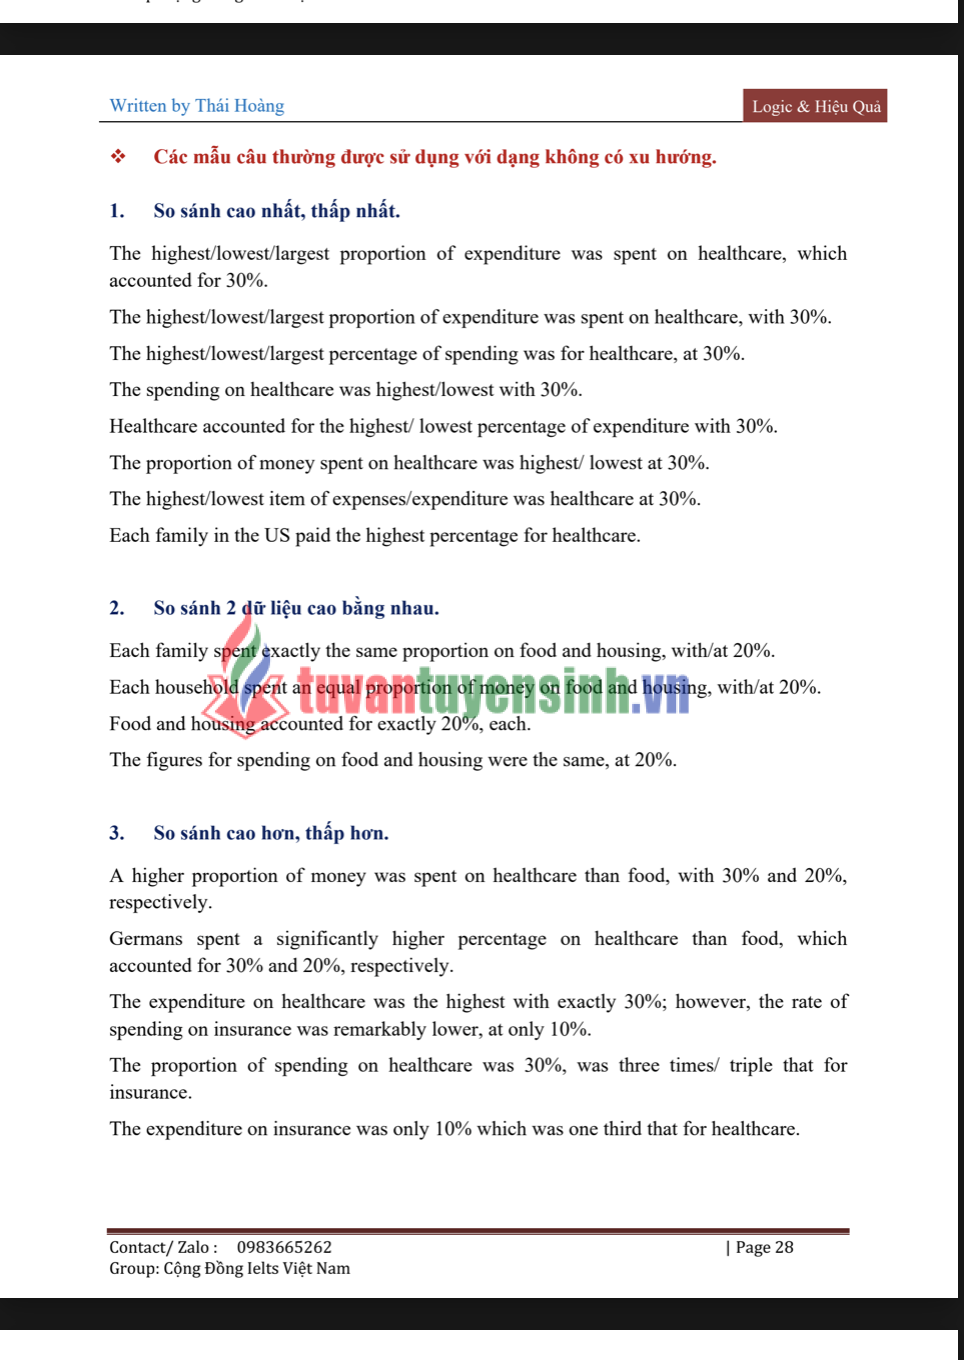
Các mẫu câu thường được sử dụng với dạng không có xu hướng.
- So sánh cao nhất, thấp nhất.
The highest/lowest/largest proportion of expenditure was spent on healthcare, which accounted for 30%.
The highest/lowest/largest proportion of expenditure was spent on healthcare, with 30%.
The highest/lowest/largest percentage of spending was for healthcare, at 30%.
The spending on healthcare was highest/lowest with 30%.
Healthcare accounted for the highest/ lowest percentage of expenditure with 30%.
The proportion of money spent on healthcare was highest/ lowest at 30%.
The highest/lowest item of expenses/expenditure was healthcare at 30%.
Each family in the US paid the highest percentage for healthcare. - So sánh 2 dữ liệu cao bằng nhau.
Each family spent exactly the same proportion on food and housing, with/at 20%.
Each household spent an equal proportion of money on food and housing, with/at 20%.
Food and housing accounted for exactly 20%, each.
The figures for spending on food and housing were the same, at 20%. - So sánh cao hơn, thấp hơn.
A higher proportion of money was spent on healthcare than food, with 30% and 20%, respectively.
Germans spent a significantly higher percentage on healthcare than food, which accounted for 30% and 20%, respectively.
The expenditure on healthcare was the highest with exactly 30%; however, the rate of spending on insurance was remarkably lower, at only 10%.
The proportion of spending on healthcare was 30%, was three times/ triple that for insurance.
The expenditure on insurance was only 10% which was one third that for healthcare.